SIGCOMM 2018 Hackathon Outcomes
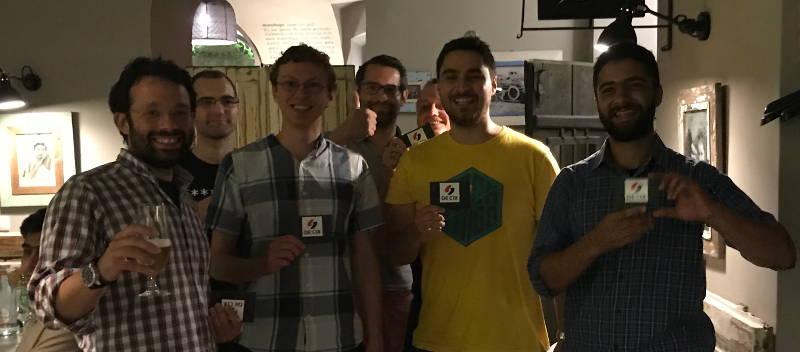
M-Lab had the pleasure of attending the first ever SIGCOMM hackathon on August 25, 2018, at the Nokia Skypark headquarters in Budapest, Hungary. The hackathon, sponsored by Nokia, DECIX, and Netflix, invited network research faculty, students, and industry professionals from around the world to form teams and develop tools, new features or analyses during the Saturday following the SIGCOMM conference.
M-Lab 10 Year Anniversary Event
We’ve reached a point in human history where, for many of us, the internet has become a standard presence in our daily lives. In the United States, the internet is simply part of how many of us engage with the world. In other countries (and parts of this one), the internet remains unaffordable, unreliable, and inaccessible. The internet unites us in many ways, and at the center of work on the future of the internet is a dedicated community of experts exploring the questions that will move the internet to the next level of its evolution: What is an open internet? What is a healthy internet? What factors contribute to the internet ecosystem’s health?
Switch discard investigation for early 2018
On February 1st, 2018, during a regular data quality review, we identified an increase in switch discards at sites with 10Gbps equipment connected to 1Gbps uplinks. We used our switch telemetry data to assess whether there were any negative consequences for tests contained in our SideStream or NDT data sets, and then we used the same data sets to determine whether our remediation strategy had any negative effects. In both cases, we found no observable effects, indicating that everything was below the noise floor for Internet performance data.
SIGCOMM 2018 Hackathon
- When: Saturday, August 25, 2018
- Where: SIGCOMM, Budapest, Hungary
M-Lab will be at this year’s SIGCOMM hackathon in Budapest, Hungary. Check out the projects we’re hoping to work on with folks on the hackathon wiki.
M-Lab is Turning 10!
- When: Aug. 7, 2018 - Aug. 8, 2018, 9AM - 5PM
- Where: New America, 740 15th St NW #900, Washington, D.C. 20005
Measurement Lab is turning 10! On August 7 and 8, we look forward to gathering the Measurement Lab community to showcase how the platform has evolved, learn from you about how you are using M-Lab, and discuss how we plan for the next 10 years of measuring the Internet and providing public data to the world. So much has changed over the last 10 years (and that’s not just our expanding volume of longitudinal data!), come celebrate, brainstorm, analyze, and share with us.
New DISCO switch telemetry dataset
Since June 2016, M-Lab has collected high resolution switch telemetry for each M-Lab server and site uplink.
Originally designed to detect switch discards from server traffic microbursts, we now support the DIScard COllection (a.k.a. DISCO) dataset as a standard M-Lab BigQuery table: measurement-lab.base_tables.switch
Say Hello to Murakami
The Measurement Lab team has always tried to make it as easy as possible to run network measurements. Currently, most users run tests either directly from the M-Lab website, or through a 3rd party integration. Over the years, many users have requested the ability to run tests on a regular basis, e.g. daily or weekly to collect data over time. Today, we’re releasing a tool that will help you do just that.
Monitoring Interconnection Performance Since the Open Internet Order
Introduction
As a platform committed to producing empirical data for the public, Measurement Lab (M-Lab) has historically supplied regulators and other governmental entities with technical facts pertinent rule-making processes. In our February 2015 submission to the FCC’s Open Internet docket, we committed to research on the state of broadband and performance impact of interconnection in the United States. Earlier this year, the FCC began the process of re-evaluating its authority over broadband Internet services, and opened a Notice of Proposed Rulemaking. This blogpost is a shortened version comments that M-Lab filed in the docket regarding its continued research on the impact of interconnection on consumer broadband. The full filing in the FCC docket includes an elaboration of our research with additional supporting evidence and charts.
Transitioning to a New Backend Pipeline and Data Availability
M-Lab data is collected from distributed experiments hosted on servers all over the world, processed in a pipeline, and published for free in both raw and parsed (structured) formats. The back end processing component for this has served us well for many years, but it’s been showing its age recently. As M-Lab collects an increasing amount of data thanks to new partnerships, we have been concerned that it will not be as reliable.
Paris Traceroute Brownout
Summary:
In February 2017, M-Lab was notified of issues with the M-Lab data available in BigQuery. Upon investigation, a problem was identified with the Paris Traceroute collection daemon which resulted in a reduction in Paris Traceroute measurements beginning in June 2016. At the peak of the outage, fourth quarter 2016 - January 2017, approximately 5% of NDT tests had an associated Paris Traceroute test. Additionally, an issue within the data processing pipeline resulted in Paris Traceroute data that was measured and collected, not being inserted into the BigQuery tables and therefore available for use.
Measurement Lab Launches New Global Data Visualization Tools
The Measurement Lab (M-Lab) global measurement platform contains the largest collection of open internet performance data on the planet. Hundreds of thousands of people (and rising everyday!) test their internet connections on M-Lab and provide that data to the public domain for research, analysis and advocacy. As a consortium of research, industry, and public-interest partners, M-Lab is dedicated to providing an ecosystem for the open, verifiable measurement of global network performance. With an extensive library of data dating back to 2009, M-Lab has over 5 petabytes of information about quality of experience on the internet contributed by people like you.
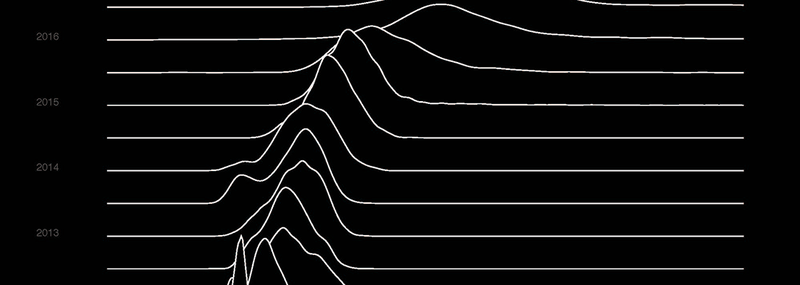
Showing Missing Data in Line Charts
The M-Lab team has been working with Bocoup’s Data Visualization team to overhaul our visualizations and give all of you better support in exploring all of the Measurement Lab data. Look for more about that soon – and reach out via support@measurementlab.net if you are interested in helping with testing and user feedback!
M-Lab has lots of data, but depending on how you slice the data, you might end up with too small of a sample size on a given day in a given location. As part of designing the Observatory visualization, we came up with the idea of using dotted lines to show that we didn’t have a large enough sample size to assert the data value, but that leaving out the data would be incorrect as well. The Bocoup Team took that further and developed a new d3 plugin, d3-line-chunked, which allows you to easily visualize gaps in your data and has good animation support.
Traffic Microbursts and their Effect on Internet Measurement
In August 2015, M-Lab was notified of potential degradation of site performance by a measurement partner based on discrepancies compared to results for their own servers. After a full investigation these patterns were found to have been caused by the unique confluence of several specific conditions. Interim remediation measures were taken in early October 2015, and the resolution of the degradation was confirmed by the partner and others. Due to these administrative actions, the episode, which we are calling the “switch discard issue,” has not affected testing conducted in the United States (the region impacted by this problem) since October 11, 2015, and thus measurements after this period are not affected by the incident. M-Lab has also conducted an evaluation of data collected during the time period in which the issue occurred, and has taken steps to remove affected measurements from its dataset. This incident will not affect use of its dataset, past or present, as a result.
Making it Easier to Use M-Lab Data
In January, M-Lab launched a beta test of new BigQuery tables for M-Lab data. Today, M-Lab is pleased to announce that the beta test was successful. The new, faster-performing tables will be M-Lab’s new standard BigQuery tables.
Before we move on to specifics, when we say faster performing, we mean a lot faster. As in, certain queries that used to take over 2 hours now complete in 8 seconds. That means that playing with the data just became a lot more fun.
To help users dig in to this data as quickly and seamlessly as possible, M-Lab has consolidated all of its data documentation and updated it to show how to take advantage of the new tables.
Announcing improved performance for M-Lab BigQuery data
Today, M-Lab is happy to announce the public beta of new M-Lab BigQuery tables. These tables provide substantially improved performance and reduce the difficulty of writing BigQuery SQL.
Data Duplication Bug in M-Lab BigQuery Data
The team working on archiving M-Lab data recently discovered that the M-Lab data hosted in BigQuery was affected by a bug that caused duplicates to appear in our dataset. Queries against M-Lab’s BigQuery dataset performed between May 2014 and April 2015 were impacted. The raw files in our Google Cloud Storage bucket were not.